Dash – A Parking Aid

For a demo of the working app, click here.

For my next project, I wanted to improve upon the parking app I created several weeks ago. The previous app is called SpotFinder, which displays a map of vacant and occupied parking spots using data provided by VIMOC through their API. I liked that service for its ability to direct drivers to find open parking spots on-demand. However, I wished that it could address the underlying need of finding parking, which I could relate to. For example, I often catch myself leaving the house only to be dismayed entering a crowded parking lot, spending up to 10-15 minutes finding parking. If I had known when I left the house that the parking lot would be busy, I would have planned my schedule differently to better allocate my time.

Screen Shot 2015-07-22 at 2.20.21 PM
Dash loads with a form and map with blue pins indicating tracked parking zones

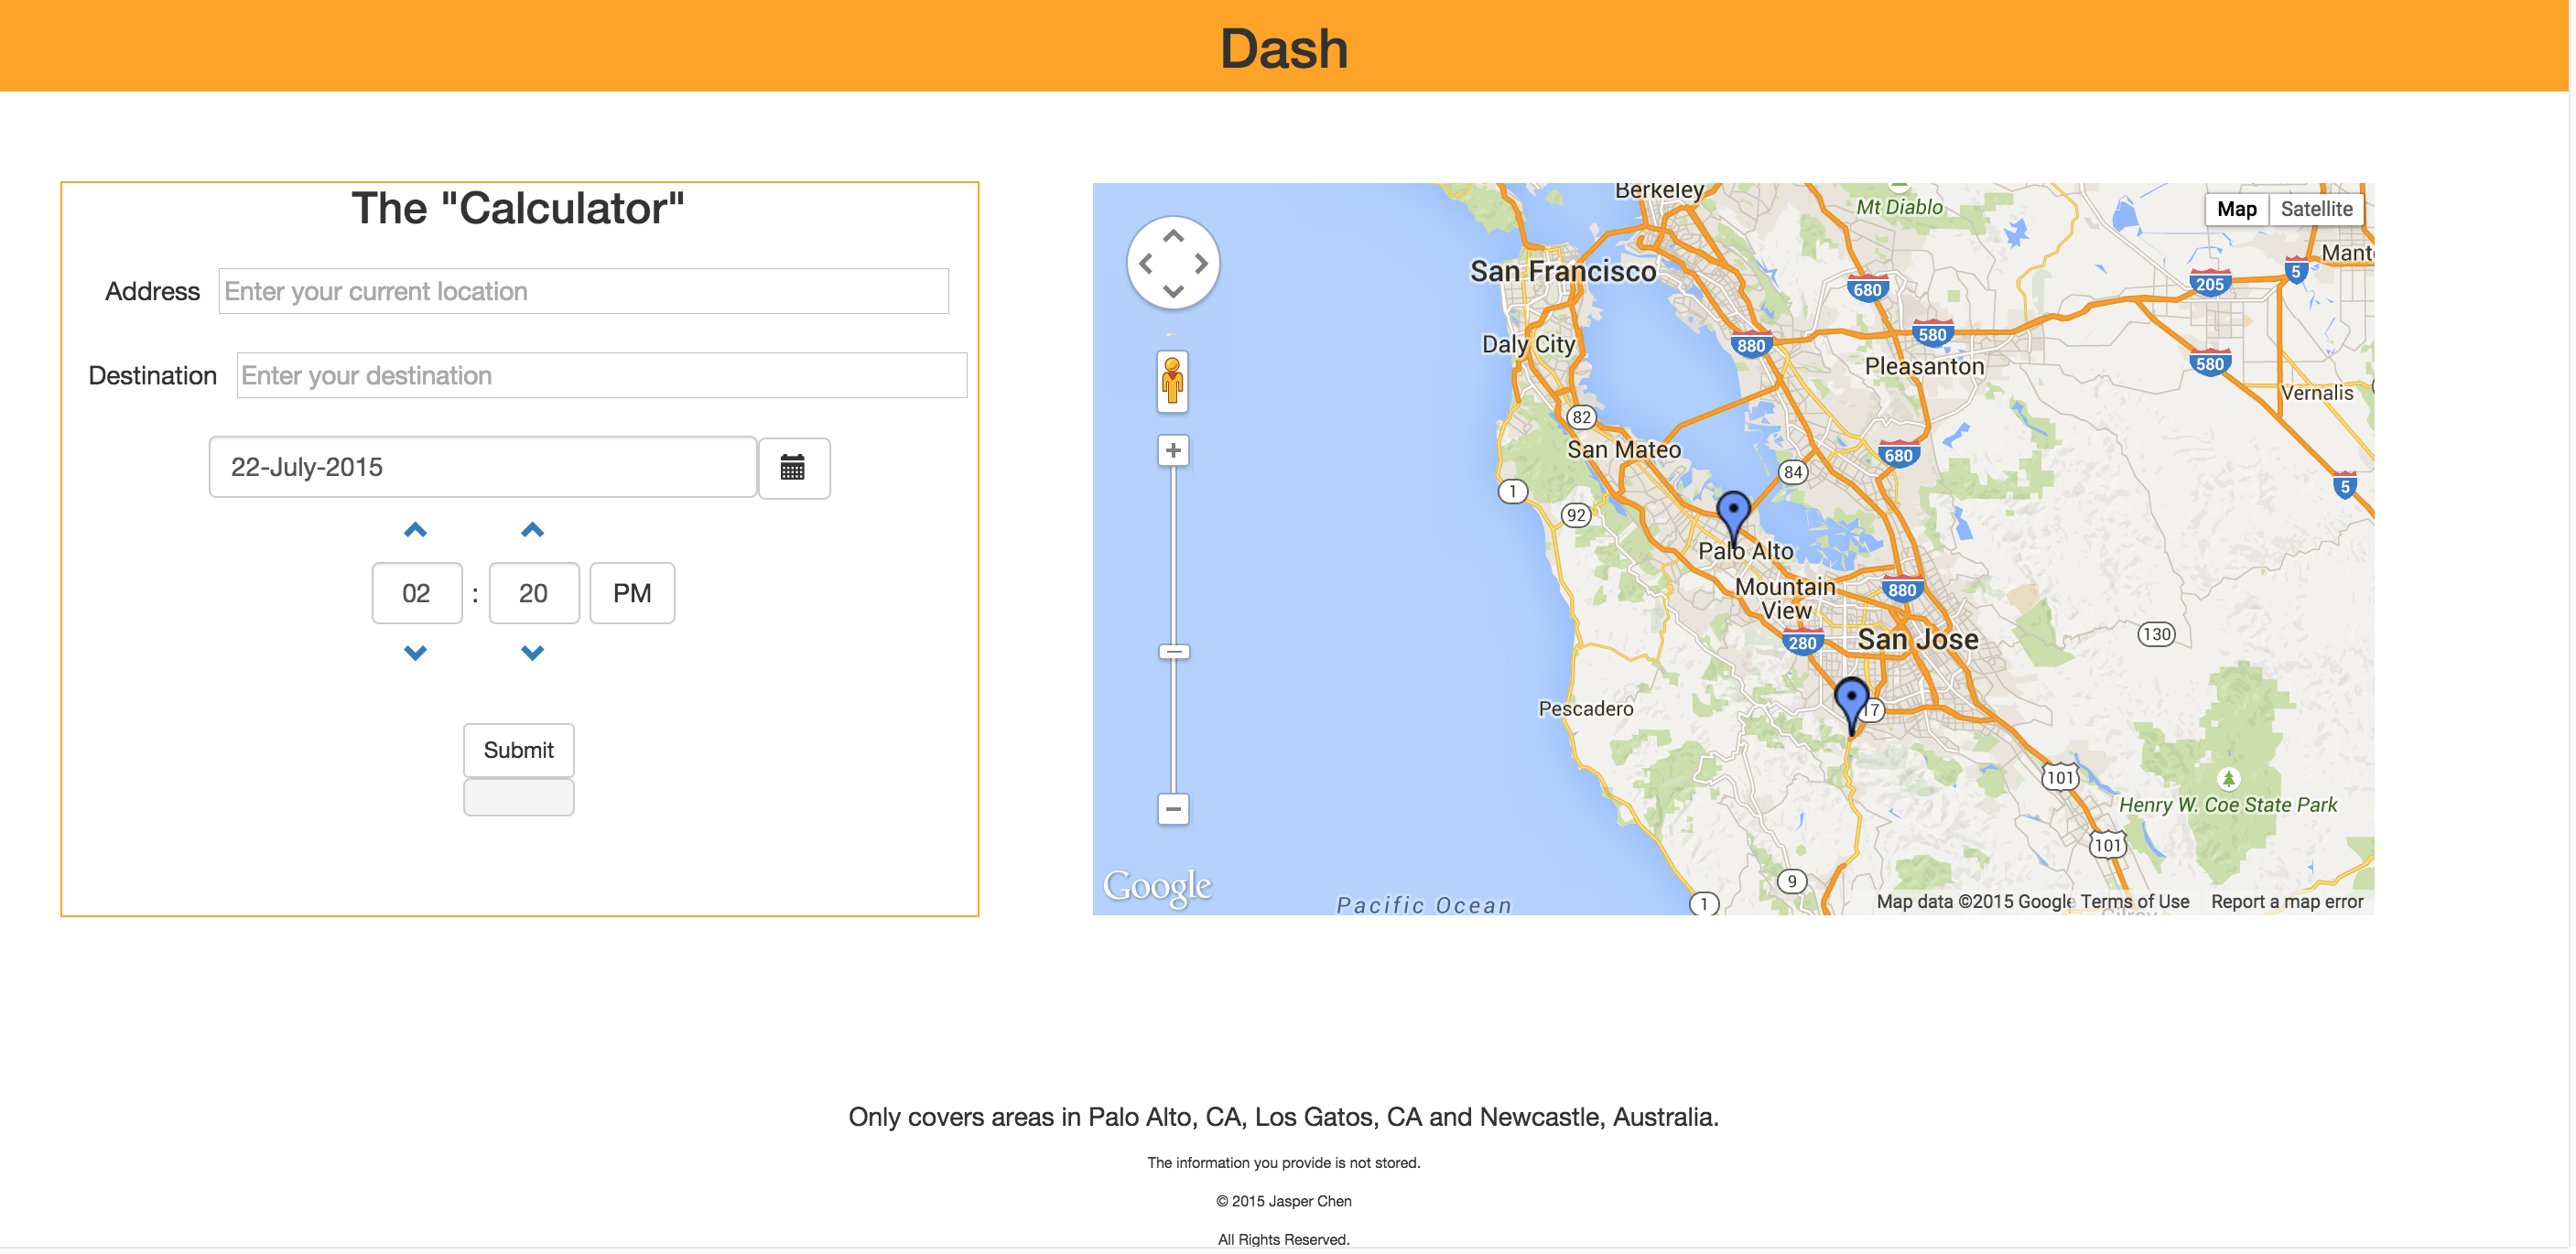
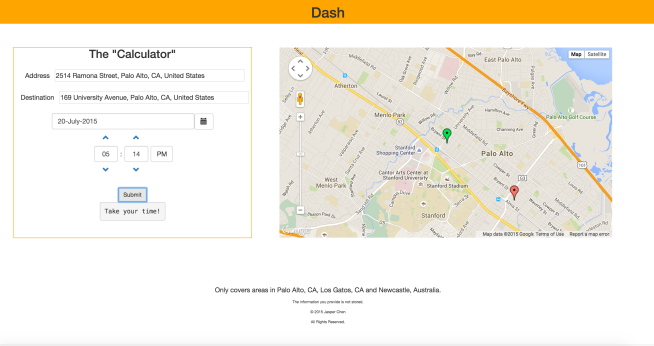
A solution to this parking problem is a web application I designed and built called Dash. Dash is a service that aids as a planner for finding parking around your schedule. Using a simple, one-page interface, Dash forecasts the availability of parking in the area closest to your destination. Simply fill the form on the left, in which you state your trip details, such as your starting location, destination and departure time. To the right is a map of blue markers which indicate the parking zones being kept track of. After you submit the details, the map to the right will update and display the route from your starting location to the nearest parking area of your destination. A red and green pin appears, indicating the user’s starting location and destination.

Screen Shot 2015-07-20 at 12.15.30 PM
Dash plots trip details and mentions that there will be no trouble finding parking.

Like SpotFinder, Dash uses the MEAN stack, which stands for MongoDB, Express.js, Angular.js and Node.js, which collectively, run the back-end and front-end of the service. Angular is a front-end framework, which serves as a broker between the a user and the back-end service. The back-end service is powered by Node and Express, which handles the requests and retrieves data from a MongoDB database of the parking zones and their corresponding occupancy rates.

NSD_Node.js-Stack
A simple visualization for describing the MEAN stack to create Dash

Since the app uses the MEAN stack, I decided to host my app on Modulus, a web application hosting platform, which enables simple integration between the hosted application and MongoDB database. It also takes care of scaling for an app, so it is a great way to host from start to finish. It is also provides clean dashboards to manage my app’s projects.

Screen Shot 2015-07-22 at 2.32.50 PM
An interactive dashboard of my hosted projects
Screen Shot 2015-07-22 at 2.32.17 PM
A dashboard displaying the specifics on the server host

But unlike SpotFinder, the project uses Amazon EC2 and S3 to ingest real-time parking and to store them for analysis using Apache Spark, a distributed and fast computing engine. An external EC2 server ingests data from VIMOC’s parking API as well as a real-time weather API and inserts the combined information as a JSON object into the S3 data store. Though the dataset is only 573 MB large, I decided to use Spark for exploration although other analysis tools, such as Pandas, which is a sufficient data analysis tool kit for a dataset this size. I fired up a cluster on my local machine with iPython notebook. The cluster manages tasks to distribute to the datasets, which are partitioned into smaller sets of data on nodes, where the data sets are independently computed. I was able to do this using a handy script I found, which sets up a Spark kernel in iPython notebook. This combination of tools (iPython and Spark) is tremendously beneficial in rapid iteration since iPython is an interactive computational environment (REPL) and Spark is a fast computing engine. In my notebook, Spark was used as a data mining tool to gather a sense of the data collected and to produce a plot of the occupancy rates using matplotlib plotting library in Downtown Palo Alto along Ramona St.

Screen Shot 2015-07-23 at 1.59.13 PM
Parking zones are nearly empty by 1 AM and 11:30 PM on this Sunday, June 28, 2015

After mining the data for information, I chose a bare-bones model of taking the averages of occupancy rates by hour to forecast future parking occupancy rates The results of the analysis are then stored into the MongoDB database as a key-value store for fast readability from the back-end.

In a more granular description of the application, several components are borrowed from Angular and 3rd party packages in Angular, such as the search boxes that autocomplete text input, is provided through Google’s API and the map, time and date controls which come from a 3rd party package written in Angular. Thanks to these open-sourced libraries, I was able to save time developing while using dashing widgets. Neat! Upon form submission, the form data is passed through an AJAX request from Angular front-end to the Node/Express.js back-end.

The back-end determines the nearest parking zone to the location, and a query to the MongoDB database is sent for the corresponding occupancy rates based on the user’s hour of departure and parking zone. The result is sent back to Node and transformed into a suggestion using thresholding based on its occupancy rate. For instance, if a zone reports a 80% or more, then the app suggests to leave soon assuming that it will take quite some time to find parking.

There are some things I would like to improve upon, for instance, the predictive model and automation of the app. With the current version, I had purposefully designed it to be simple due to time constraints. In future iterations, I plan on incorporating a more developed machine learning model, training on features such as the day of the week, time of day and location. In addition, I would also like to integrate Spark into the back-end, where Spark can read from an updated dataset of parking data in real-time and forecast occupancy rates.

A Big (Data) Adventure Part 2

After learning quite a bit about Spark, I was given the opportunity by my employer to attend Spark Summit 2015 in San Francisco on June 15 – 16. The conference was a full house.

Day 1 - Keynote
Keynote on Spark by creator Matei Zaharia


In the beginning of the conference, there were several keynote speeches, which in summary, underlined the history of Spark, its latest release and the status of Spark and the business ecosystem. Spark is certainly under active development with its release of 1.4 two weeks ago. It has several additional upgrades over the previous release, but the main highlights were its new addition of R compatibility, growing machine learning library, development of the DataFrame API and project Tungsten in an effort to optimize the performance of Spark. As for the status of business adoption of Spark, Spark is alive and well with companies developing on Spark, such as IBM committing 3,500 engineers to the open-source development and companies like Toyota, Airbnb and OpenTable using Spark into their products or internally.

The keynote that piqued my interest the most was the live demonstration using the Databricks Cloud interface (Databricks is a company that provides hosting services for to live stream tweets and analyze and display the sentiments on a dashboard. The browser-based interface made the process simple in setting the servers and clusters. What makes this platform so impressive is how easy it is for a data scientist to develop a predictive application. For one, you can use their built-in notebook to interact with the data interactively, an important need for any data scientist. In addition, more time can be spent on the app development since most of the setting up of the servers and clusters are taken care for you. This type of tool provides tremendous productivity for data scientists as it supplements their workflow.

20150615_162021
A crowd of attendees at an information session

That was not the only thing I was excited about. During the breaks between talks, I visited the on-going information sessions. I was in a room full of data scientists, software engineers and business developers driving the movement behind Spark. One would be deterred by how packed and frantic the information sessions were, but it was inspiring for me to see so many interested in Spark as much, if not more, than I was.

A Big (Data) Adventure Part 1

Just a couple months ago, I was a busy college Junior excited about Spark. Spark is a distributed computing engine that was incubated at UC Berkeley and has recently become a very hot subject in the Big Data sphere. Unlike Hadoop MapReduce, Spark can cache data in-memory and as a result reduce latency, which allows for quick data processing. What this means for data scientists is that it increases development time, as waiting for a job to complete is drastically reduced.

As a full-time college student on summer break, I finally found the time to dive into Spark and build a web app with Spark. So far, Spark itself has been relatively straight forward to learn, but I am challenged by understanding the rest of the ecosystem. In an effort to describe my experience, picture this scenario: you are trying to build a custom bike. You have decided the type of bike it is and have researched and spec’ed the parts you could use like the frame, tires, chains as well as the screws, nuts and bolts.

screw-bolts
Some of the many different types of fasteners

Now you want to choose the cheapest, quickest and simplest configuration of the parts for your bike. Not so easy, huh? Spark is a part and to understand how it fits in the system, I needed to learn about the other parts like databases (non-relational, relational), web services (file systems, publisher-subscribers) and protocols (http, tcp/ip). There was certainly quite a bit to learn, a great deal of time spent and frustration in the process, but it has boosted my confidence in building an predictive web app from the ground up.

SpotFinder – Where Can I Park?

I finally finished my first app at Progress Software named SpotFinder, which you can try here. SpotFinder allows you to view the real-time availability of parking spaces in your local area using parking sensor data provided by a startup called VIMOC. They provide a computing platform which enables municipalities to aggregate and process sensory data. Municipalities are using this to manage traffic and parking congestion. For information about what they do, visit their website here. The web app is hosted on a Modulus server and runs on a simple Node server using Express as a web framework and linked to an Angular client app. These tools have enabled me to develop my web app quickly. Modulus provides a hosting platform which simplifies deployment. Express allows you to write fewer lines of server-side code. Angular makes it easier for displaying dynamic views since it uses directives. The system is configured where the client app sends an AJAX request to the Node server for it to run processes and return information. In this project, the Node server makes HTTP requests to VIMOC’s API, which has data on the coordinates of the parking sensors in a zone and which parking spots are occupied. The server joins the coordinates and occupancy data and returns that information for the client to display shown below. The client loads a Google Maps image by using the Angular Google Maps API and then populates the map with pins. Screen Shot 2015-06-03 at 11.50.03 AM In this demo, there are 22 pins located on Ramona Street in Downtown Palo Alto, where the parking sensors have been installed. The green pins indicate where the parking spots are vacant and the red pins indicate where the parking spots are occupied. Thank you VIMOC for letting us use your parking API! The VIMOC API also includes analytics on parking data including the average duration of parking events, the turnover of parking spaces per hour, vacancy and occupancy rate. I hope that this article has sparked some ideas around sensor data in IoT (Internet of Things). What projects are you excited about in IoT? Feel free to leave some comments or questions below.

If you enjoyed reading this article, you may also enjoy reading about the mobile app Spotter that Antony Bello developed, which finds the nearest vacant parking spot near you. It uses NativeScript, a framework for creating iOS and Android apps using only Javascript and CSS. Pretty neat, huh?